Reset Spotfire BarChart Data limit and Axis Value Reset


from Spotfire.Dxp.Application.Visuals import AxisRange from Spotfire.Dxp.Application.Visuals import VisualContent vc=vis.As[VisualContent]() vc.Data.WhereClauseExpression=”[Amounts]<>0 and ([Days]< Max([Days]))” vc.XAxis.ZoomRange = AxisRange.DefaultRange; vc.YAxis.ZoomRange = AxisRange.(0,200); Note: vis is a parameter which needs to be assigned with Chart
Hide Spotfire data table column using python script
from Spotfire.Dxp.Application.Visuals import CrossTablePlot crossTable = ct.As[CrossTablePlot]() crossTable.RowHeaderWidths[0]=0 crossTable.RowHeaderWidths[1]=0
Creating D3 Visualizations with in Spotfire
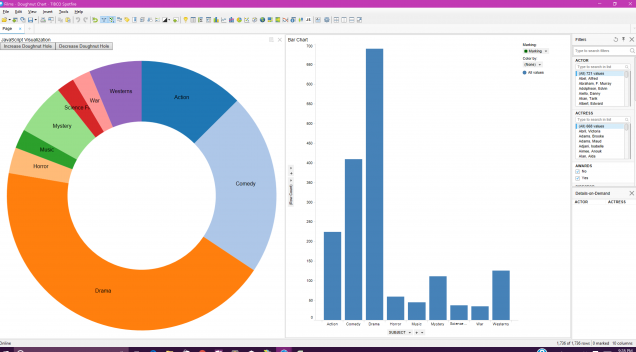

I have made a video tutorial of this D3 Visualization within Spotfire Client. Please look into the following link for the video Also please find the attached CSS & JavaScritps which I used in this tutorial from the below link.
Recent Comments